A stock app for macOS · free
See how far a stock could go.
Veduta simulates thousands of paths for a stock, draws the range they land in, and keeps score of how often that range turned out right. Portfolio, watchlist, news and a paper account sit around it.
A veduta is a view of a city painted to be accurate rather than flattering. Here Milan's skyline is the price line, and the fan after it is what the app draws next: where half, and nine in ten, of the simulated paths end.
p5 · p25 · p50 · p75 · p95The app
One stock at a time, or the whole book.
These are screens from the app itself, running on demo prices.
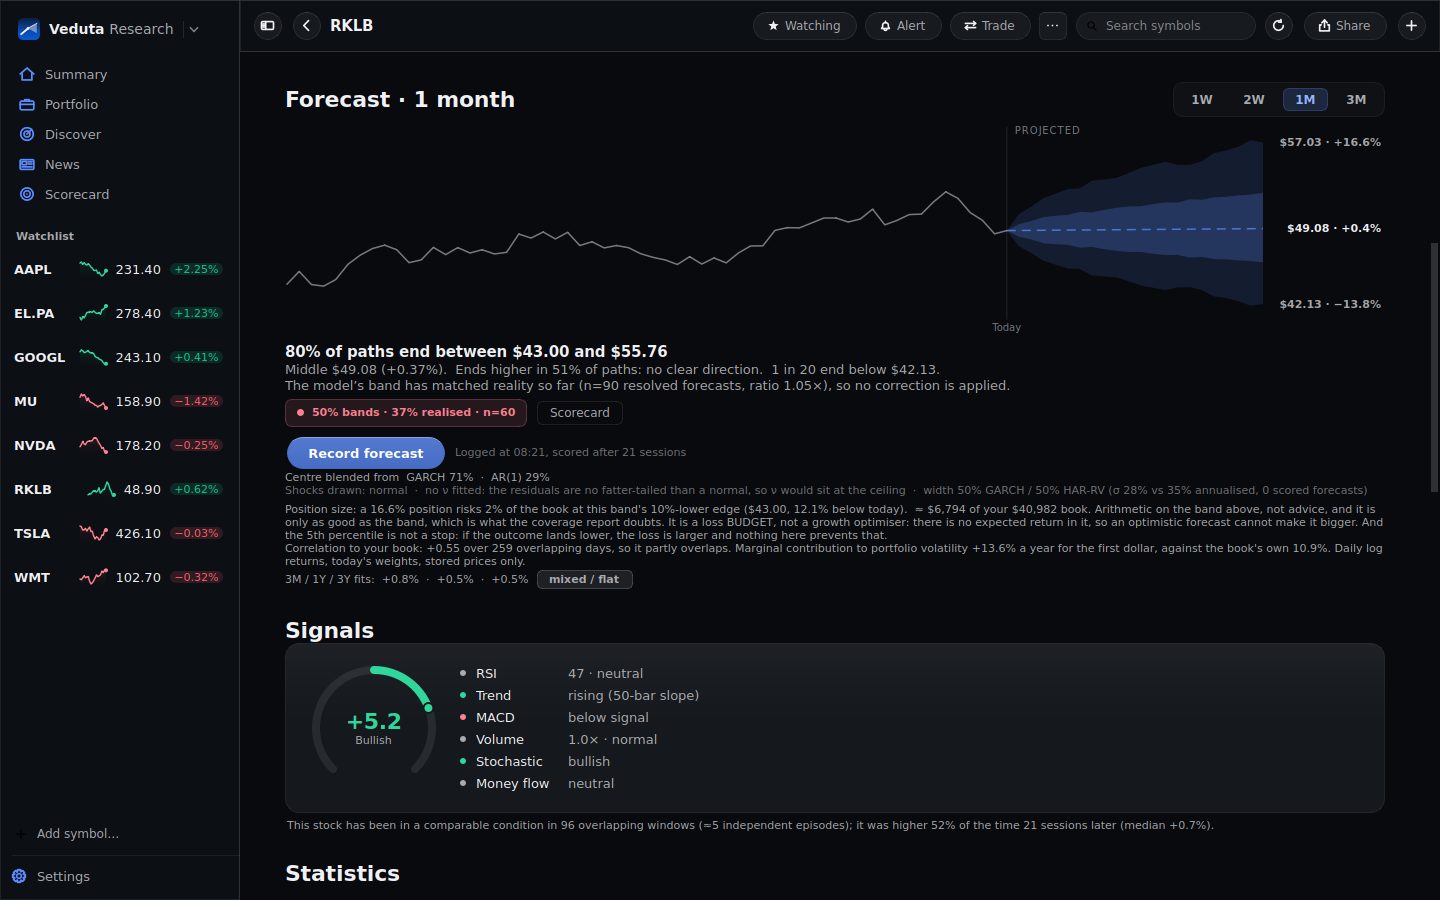
The forecast leads with the range
Each stock opens on its chart and, under it, where the price is likely to be in a week, a month or three. The headline is the band, because at those horizons that is what a model can say. The chance of ending higher sits beside it, and says so when there is no clear lean.
- Volatility from GARCH and realised variance, with fat tails when the data has them
- Earnings dates widen the band on the days they fall
- Analysts' targets shown for comparison, never mixed in
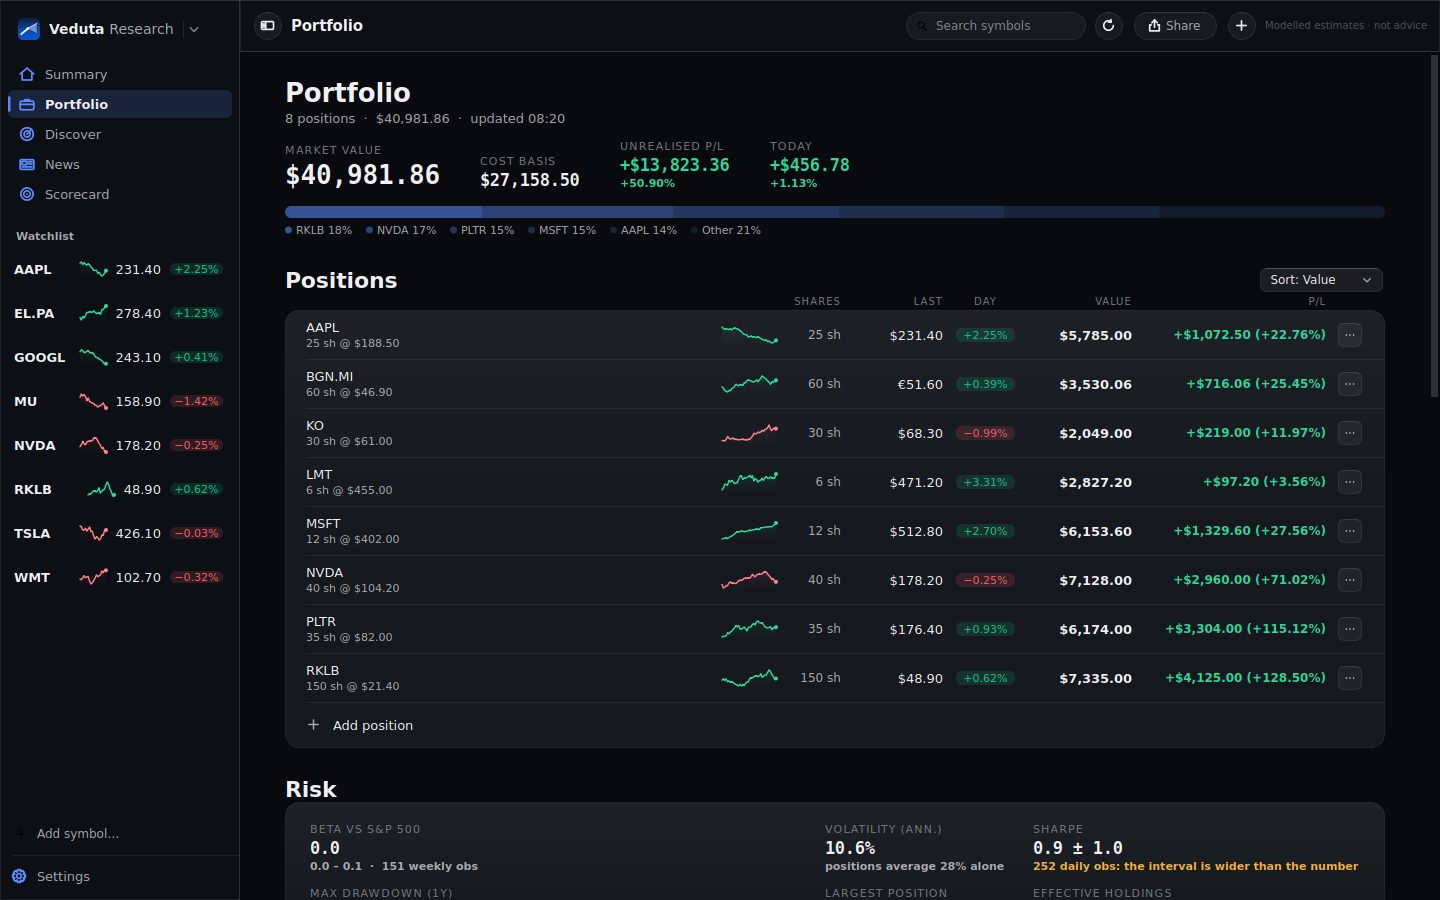
A portfolio in your currency
Milan and Paris listings are valued at the day's exchange rate and shown in the currency you choose. Risk comes with its uncertainty attached: beta with its interval, a Sharpe ratio with its error, and a simulated worst month.
- Buying more of a stock adds to one position at the average cost
- A benchmark of your choosing, from the S&P 500 to the Euro Stoxx
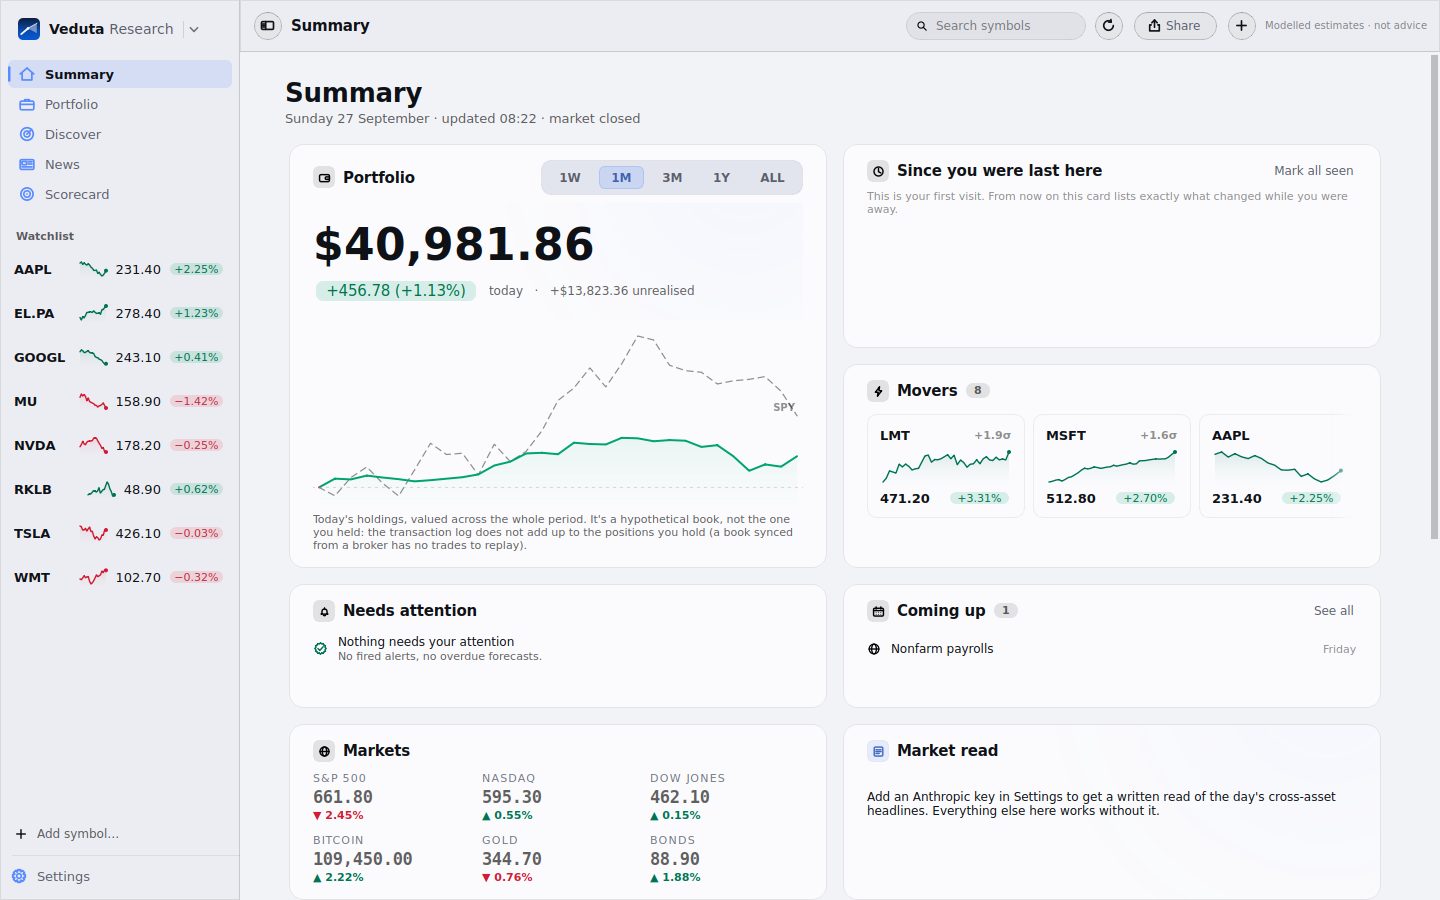
A summary for the morning
Your book and how it moved, what changed since you last opened the app, the indices, what is coming up this week, and anything that needs you: an alert that fired, a forecast ready to be scored.
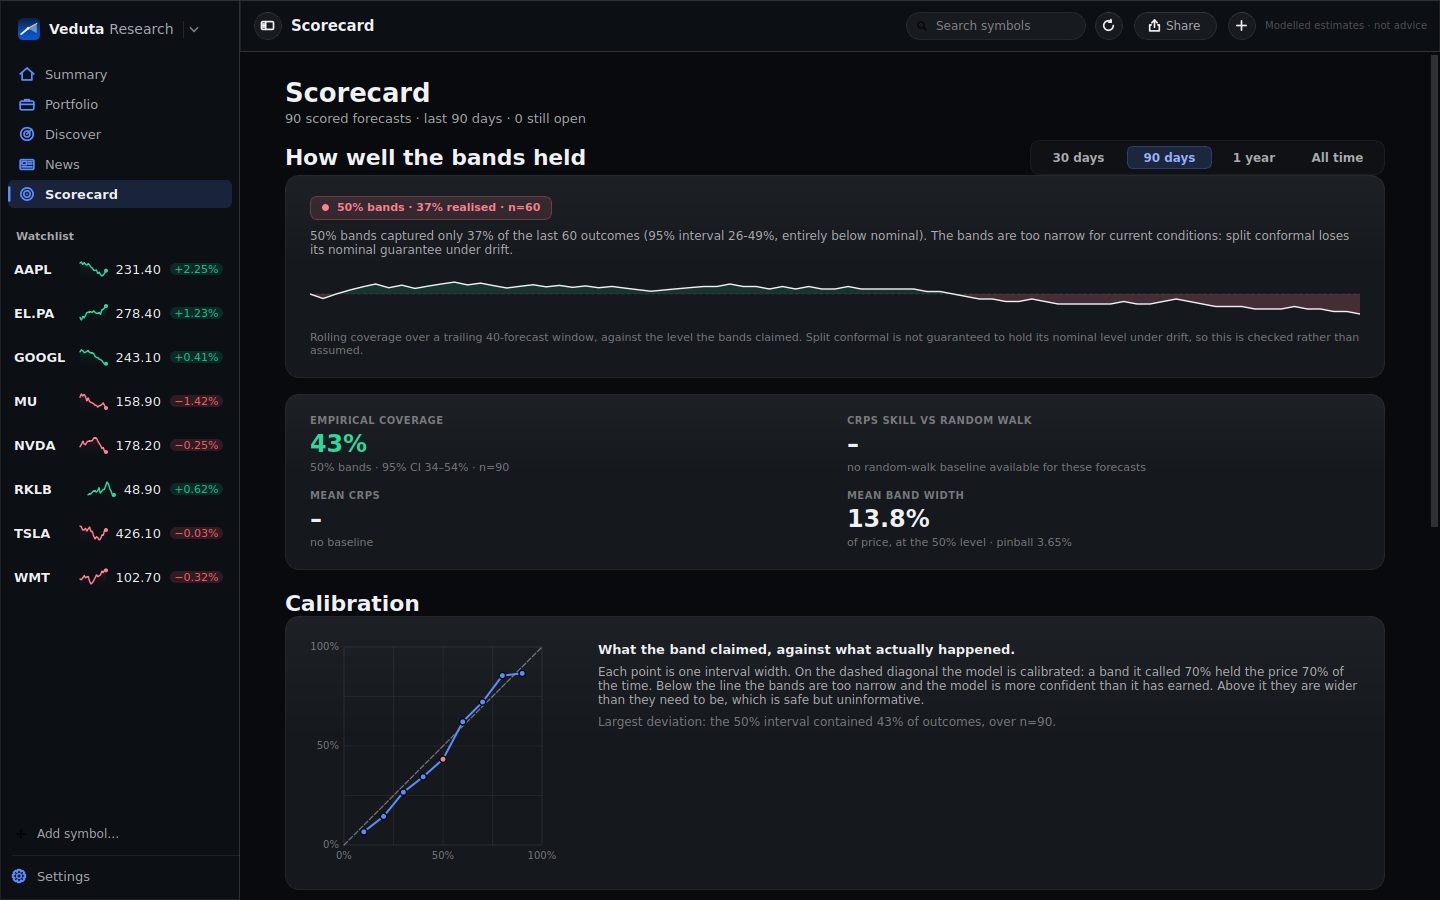
It keeps score
Every band the app draws is logged and scored when its horizon lands. The Scorecard shows how often the bands held what they claimed, and says so plainly when they have been too narrow, as in this example. Once there are enough scored, the app widens its own bands to match what it got wrong.
How the forecast works
Try the band on a $100 stock.
This is the same arithmetic the app uses for the width of its band, reduced to two dials. Drag them and read the sentence underneath, which is written the way the app writes it.
Horizon
What the app would say
50% of paths end between $93 and $108
Middle $100.29. Ends higher in 52% of paths: no clear direction. 1 in 20 end below $81.
- Measure how much it moves
A GARCH(1,1) model fitted to the stock's own daily returns, blended with realised variance, gives the width. Big recent moves widen it; a quiet stretch lets it narrow.
- Simulate the paths
Hundreds of paths are drawn forward day by day, with fat-tailed shocks where the stock's history has them. The band is where those paths end.
- Lean only as far as the evidence allows
Momentum, news tone and similar past setups can move the centre, each inside a small budget, because at a few weeks almost nothing predicts direction reliably.
- Check the band against what happened
Each forecast is scored at its horizon. When the bands cover less often than they claim, they are widened by exactly the shortfall.
In numbers
Counted by the site, live.
Downloads
In the last 30 days
Macs using it this month
Releases
Macs using it are counted only where someone switched on usage statistics in the app's settings. Nobody is counted by default.
Download
Put it on your Mac.
- Download the disk image and open it.
- Drag Veduta into Applications.
- Open it from Applications. The first launch takes a minute while it fetches your first prices.
- Optional: add free keys for backup price sources in Settings > Keys. Each key box says where to get one.
- Version
- Released
- Size
- Needs
- macOS 12 or later, on Apple silicon
- Costs
- Nothing. Optional AI text uses your own Anthropic key.
- Data
- Your portfolio stays on your Mac. See what leaves it.
Changelog
What changed lately.
Questions
Asked before downloading.
Is this financial advice?
No. Every number comes from statistical models fitted to past prices. They describe what those models compute. They carry no guarantee and they are not a recommendation to buy or sell anything.
Where do the prices come from?
From Yahoo Finance by default, with no key. If Yahoo is limiting your network, free keys from Twelve Data, Finnhub, Tiingo or EODHD fill in; Settings says which one covers which markets.
Does it work with European stocks?
Yes. Milan, Paris, Frankfurt, London and other listings chart and forecast in their own currency, and the portfolio converts them at the day's exchange rate.
Can it trade?
It has a paper account for practice, with realistic fills and stops. It can also send orders to an Alpaca account you connect, always through a confirmation step.
What does it send back to you?
Nothing unless you switch on usage statistics, and then only how long the app was open and which pages were used. Never symbols, holdings or keys. The privacy page has the full list.
Why is there no Windows version?
It is built for macOS first. A Windows build is possible later.